Three challenges with NetSuite reporting & how to solve them with Kleene
For many organizations, NetSuite is the foundation of their data strategy, yet not the only component. In order to shift to a data driven organizational approach, companies require all-encompassing, readily available data that can be transformed into insights. In this blog we will discuss three key challenges:- Slow extraction of reports
- No ability to blend data
- Limited dashboards and reports
1. Slow extraction of reports & inconsistent data
NetSuite’s Saved Searches allows you to specify criteria and search through multiple records in NetSuite to pull the exact data you require. However, this is not built for comprehensive reporting. In order to pull a report users have to select from an ever-expanding list of previous Saved Searches each created by different users with different criteria. This can result in inconsistent results. Joining data from other tables in Netsuite can be incredibly complex as the rules for their interaction are not part of the software, but rather something that users have to work out themselves from complex field names. Further complexity is added as calculated values and SQL queries are introduced.
Creating and customizing reports from NetSuite can be extremely time-consuming due to the slow extraction of data which often is then too large to open using excel or similar. There are various reasons for slow reporting:
- The sheer volume of transactions returned
- The complexity of joining different elements such as sales and inventory,
- More technical issues like event based scripts running.
There are lots of articles with tips on how to speed up reports such as filtering, reducing date ranges, not using “contains”, and removing columns. These workarounds certainly help the speed of extraction, but don’t solve the actual problem and can cause the intended output to be diluted in effect.
What are the consequences of this?
Consequently, users are not able to access their data in good time and instead need to wait for a scheduled report to eventually complete - sometimes hours later. This inhibits organizations in their ability to react to ever-changing market conditions and organizational changes, resulting in slow decision making that is not driven by consistent and up to date outputs. For example:
- Salespeople could easily miss that a particular customer had not placed an order that they would usually place, instead having moved to a competitor.
- Supply chain management might be unaware that a large sales order had recently taken a high percentage of the remaining stock of a particular line, that they could have begun the process of back-filling.
We know NetSuite reporting is not an easy task and leads to several consequences. Solving them can be the hardest part, but you're not alone.
How Kleene can help
Kleene combines Netsuite data along with all of your other data sources in one place, combining all your data into a single source of truth to make it easier for your teams to work at speed. With all your data in one place, you are empowered to make well-informed decisions. This speeds up the reporting process by running your queries ahead of time and making ad-hoc reporting rapid and simple for analysts and business users.
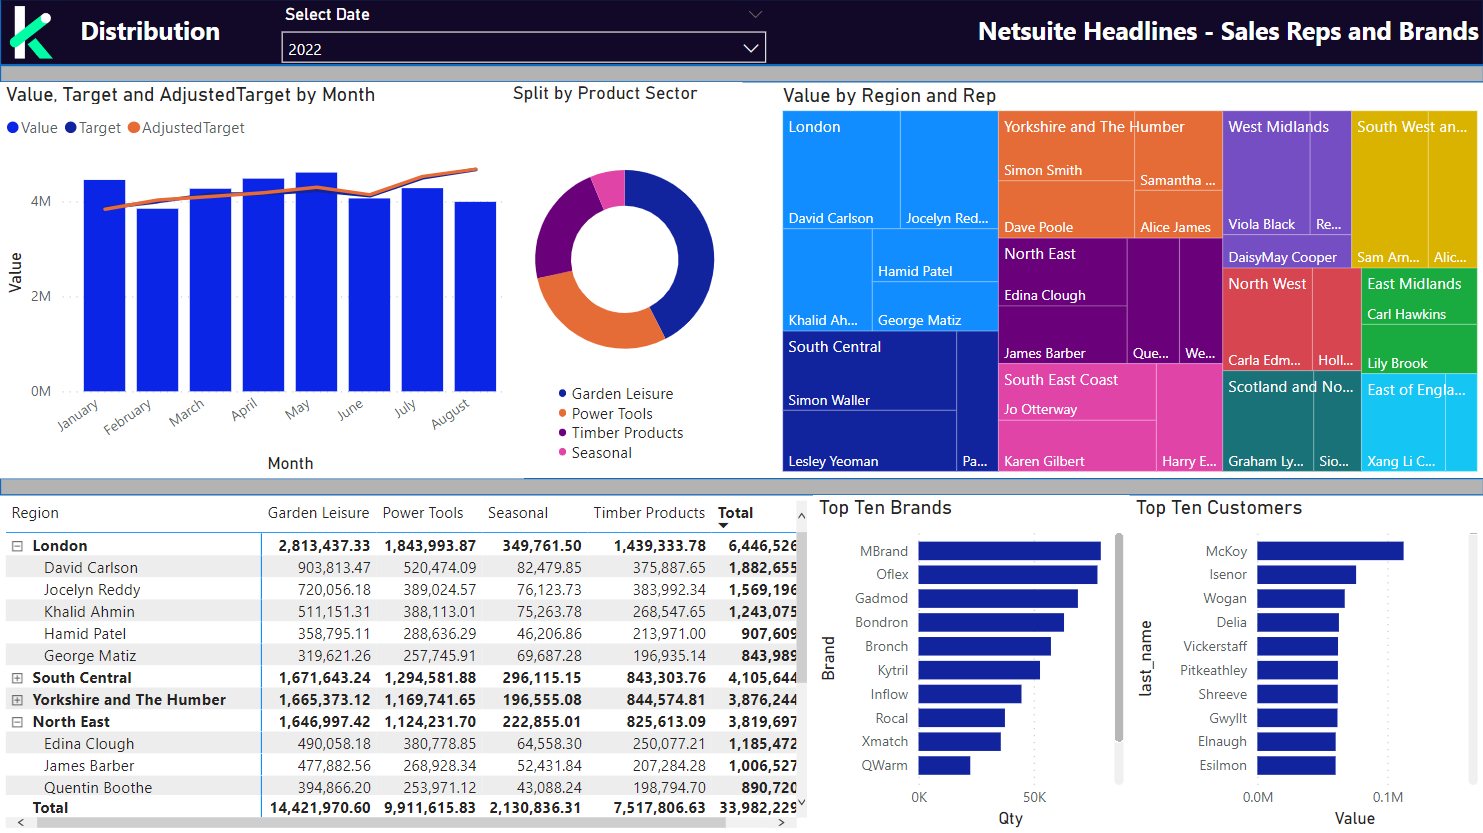
Here is an example of a dashboard created by the Kleene team, this is an executive overview, joining together sales team performance and product performance against sales targets. This interactive dashboard allows you to click and filter down to individual sales representatives, regions, products and more.
2. No ability to blend data from other sources
As an ERP system, NetSuite hosts a huge amount of business critical data, but critical data also exists elsewhere. NetSuite, like most ERP systems, works best with its own data. Pulling in data from outside sources begins to complicate the reporting process, and limits the capabilities and performance.
Ingesting data from external sources into Netsuite itself is often used as a solution for the disparate sets of data but only exacerbates the issue with reporting speed and ends up with complex table structures with multiple custom fields.
What are the consequences of this?
As a result, this leaves organizations unable to pull extensive reports covering all areas of their department or organization in its entirety. Blending in another data source, such as ad spend for marketing, involves exporting your saved search and combining it with Excel. This process is often laborious and repetitive leading to reduced frequency of reporting.
How Kleene can help
First, Kleene helps you discover all the different data sources that exist in your organization alongside Netsuite. Next, the data is ingested, bringing together all the data from all your data sources into one place, removing data silos. Kleene's powerful master layer refines raw data into business-ready inputs that empower superior insights, analysis and decision making. Finally, we integrate with your BI tool to empower self-service with bespoke dashboards that will drive the decision making in your business.
3. Limited dashboards and reports
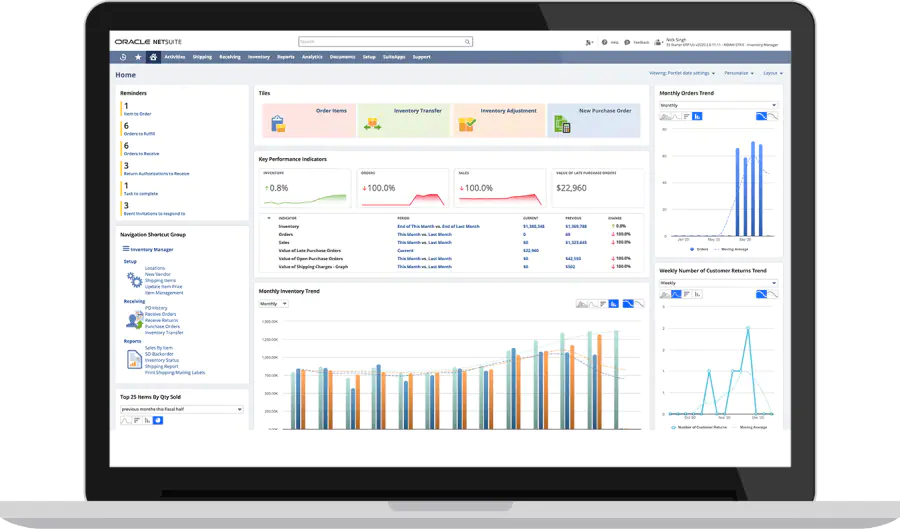
Wish you could get more from your NetSuite reports? Many of our customers came to us wishing their reports had more to say. Reporting in NetSuite is a largely manual process where typically, users pull specific data from NetSuite and import this into Excel. Within NetSuite, whilst you have reasonably robust internal dashboarding, it is relatively restricted in what it can show you before having to fall back on the slow extract-based reports and cannot show you any data that is not already housed in Netsuite.
What are the consequences of this?
While the internal Netsuite dashboards are good enough, there is limited customizability and no ability to consume external data. As a consequence of this, organizations are making decisions based on incomplete data and are also unable to customize their reporting to include business-specific outcomes.
It is very straightforward and easy to solve this when you have the right support helping you. Kleene partners with leading BI tools such as PowerBI, Tableau and Looker and provides data from across your entire organization to power sophisticated visualizations, allowing you to uncover new insights that would not previously have been accessible. Here is another example dashboard created by our Kleene team, this allows you to analyze product performance at a SKU level. In this interactive dashboard you can filter by sector or brand to see product availability, requirement and stock projections per stock location, per SKU. You can also drill down to the transactions to see product movement in more detail.
.png?width=1484&name=image%20(2).png)
Kleene automates the discovery, ingestion and transformation of your data, combining multiple data sources across your organization and powering dashboards, giving you more time to focus on acting on the insights that are uncovered. Kleene does the heavy lifting for you, taking away the demanding manual task of combining your data and instead providing access to far more dynamic reporting tools, encompassing data from all your sources across the business. This can be quickly reported against and forms the foundation for powerful dashboards that give you the actionable insights you need to grow your business.
Contact our team to get started.